Real-World Problems Caused by Misreading Steel Pipe Charts
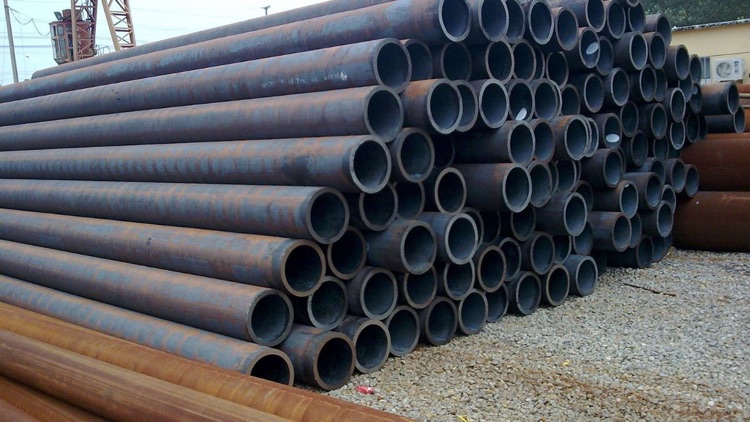
Steel pipe charts are commonly implemented in engineering, construction, oil and gas, and water systems to specify the size of pipes, the thickness of their walls, their weights, and their schedules. The purpose of these charts is to assist the buyer and engineers in selecting the right pipe within a short time and in a safe manner. Nevertheless, there are numerous practical issues when individuals interpret or read such charts poorly. Even a minor error in reading the steel pipe chart may result in incorrect choice of material, failure of installation, or even severe safety hazards in any industrial project.
Wrong Pipe Size Selection Due to Confusion between NPS and OD
A very widespread issue occurs when shoppers mix up Nominal Pipe Size (NPS) with Outside Diameter (OD). NPS and OD are only identifying names in steel pipe charts, and OD is a constant measurement. Not all buyers are aware that a 2-inch pipe does not necessarily have an outer diameter of 2 inches.
This misunderstanding often leads to:
- Improper fitting with flanges or connectors
- Installation mismatch issues
- Project delays and rework
- Increased material and replacement cost
Installation Failures Caused by Ignoring Pipe Schedule Differences
Pipe schedule is the thickness of the wall of a steel pipe, which is commonly not given due attention or read. Most buyers use Schedule 40 over Schedule 80, just because they think that all pipes of the same diameter will do the same job. In practice, Schedule 80 is more robust in the wall and has greater pressure capacity.
Incorrect selection can result in:
- Pipe failure under pressure
- Leakage in joints
- Structural rupture in extreme cases
- Serious risks in oil, gas, and chemical systems
Structural Weakness from Ignoring Wall Thickness Tolerance
Steel pipe charts typically indicate nominal wall thickness, whereas actual manufacture is within the tolerance limits. Not all users are aware that wall thickness can be within acceptable tolerances, say +12.5%. This detail may be misunderstood or overlooked, causing severe design problems. When engineers formulate a system using nominal values only, there is a possibility that the installed pipe will be a bit weaker than the nominal value. This may, over time, decrease safety margins and augment the tendency to collapse during pressure or load scenarios.
Cost Overruns Caused by Incorrect Weight Estimation
Another crucial component of pipe charts is steel pipe weight, which is usually computed inaccurately. There are instances where buyers do not take into consideration the difference in weight between schedules or sizes. E.g., Schedule 80 pipes are much heavier than Schedule 40 pipes of the same diameter.
This can lead to:
- Incorrect shipping cost estimation
- Wrong lifting and handling requirements
- Budget overruns in large projects
- Logistical delays
Procurement Mistakes Due to Mixing Different Standards
The other severe issue is the confusion of pipe standards like ASTM, API, and EN. The steel pipe graphs can be similar; however, the dimensional tolerance, test, and use of the standards vary across standards. Other buyers presume that all charts are similar, and this results in the wrong materials. This may lead to rejected shipments, unsuccessful inspections, and project delays in real-world procurement. It also puts the chances of using inappropriate pipes into use that are not applicable to the required pressure or temperature levels.
Project Delays Caused by Wrong Assumptions in Charts
A lot of wastage of time in industrial projects occurs when teams work based on the pipe charts without knowledge of what is going on in the real world.
Charts provide technical data, but they do not include:
- Pressure fluctuations
- Environmental conditions
- On-site handling factors
Misinterpretation leads to:
- Wrong pipe selection
- Redesign and rework
- Material reordering
- Increased project time and cost
The charts can give technical information; however, they do not indicate such aspects as pressure changes, the workplace, or handling conditions. When chart data is misread or oversimplified by engineers, they will pick pipes that are not good on-site. This will result in redesign, re-sequencing materials, and longer project schedules, which add cost and decrease efficiency to the overall project.
Conclusion
Poor interpretation of steel pipe charts may lead to a series of issues, such as mistakes in sizing, safety issues, cost loss, and project delays. These problems are frequently not due to a faulty chart, but to a misconception that the chart is being utilized out of context or not understood thoroughly. Proper interpretation of OD, NPS, schedule, weight, and standards is vital in real-world engineering and procurement. Adequate knowledge of steel pipe charts assists in promoting safer designs, easier installation, and cost-efficient project implementation.